Field layer:
Select MCDA option
new criteria

New Criteria

delete criteria

Delete Criteria

AHP weights

AHP Weights

CriteriaWeight
Subcriteria
Min/Max
Rel Weights
Indifference (%)
  • Main Criteria
Hi
Value Rank Comment
Select All
Unselect All
select fieldsSelect fields to show in output:

Criteria Weight Subcriteria Min/Max Relative Weights Indifference (%)

Options

Basic option allows users to run every tool for watershed delineation automatically at once. Advanced option allows users to run any specified tools with customized inputs. Watershed Extraction option outputs entire watershed as a polygon shapefile by running only necessary steps - 'Move Outlets' and 'Gage Watershed'.
Basic Advanced Watershed Extraction
Select folder (optional) :

Automatic

This tool runs every step in the advanced option automatically. The outlet points will be moved to modified Peuker Douglas stream pixels. 10 pixels will be used as a stream threshold if drop analysis can't find the optimal value. The input DEM should be in a projected coordinate system with the same units of X, Y, and height. Otherwise, the slope raster's unit should be interpreted as [unit of height] / [unit of X and Y].
Computation Mode:
DEM:
Outlet point layer:

Watershed Extraction

This tool creates the entire watershed shapefile for the moved outlet points. Once user uploads or define outlet points, they will be moved to stream pixels automatically. The NHD+ v2.0 HydroDEM (stream-burned) pixels of values less than -100m were determined as stream pixels.
Boundary Mask:
Outlet point layer:
Watershed:

Clip DEM (optional)

This tool clips out NHD+ v2.0 DEM for input DEM (Note: This DEM is not burned DEM). Please drag mouse to the extent less than HUC 10 because clipping size is limited.

Fill Sinks

This tool fills out pits of input DEM to make input DEM hydrologically reasonable. The input DEM should be in a projected coordinate system. Later 'Stream Network - Drop Analysis' and 'Stream Raster - Threshold' tools accept only rasters in a projected coordinate system.
DEM input raster:
Burn in stream layer (optional):
Output raster:

Compute Flow Direction

This tool creates two output grids - flow direction raster and slope raster, both in eight directions. The input DEM should be in a projected coordinate system. If input DEM is not in a projected coordinate system, the slope raster's unit should be interpreted as [unit of height] / [unit of X and Y].
Filled DEM:
Flow direction raster:
Slope raster:

Compute Flow Accumulation

Flow accumulation is calculated by summing up contributing numbers of pixels, through which stream flows into the target pixel. Please choose eight direction - flow direction raster as an input file.
Flow direction:
Flow accumulation raster:

Grid Analysis

This tool gives three outputs such as the longest flow path, total length of flow path, and Strahler Grid Network order.
Flow direction:
Longest flow path:
Total length of flow paths:
Grid network order:

Stream Network - Modified Peuker Douglas

This tool delineates stream pixes by the Modified Peuker Douglas Tool, which uses flow accumulation pixels in addition to original Peuker Douglas pixels.
Filled DEM raster:
Flow Accumulation raster:
Peuker Douglas Stream Network:

Move Outlets

This tool moves user-uploaded or user-defined outlet points to stream pixels. Please upload outlet points shapefile by right clicking on folders or Spatial Layers in Project Layers section. Or click 'Create Layer' button and add outlets on the map. If you choose to upload shapefile, please upload files with formats - .shp, .shx and .dbf.
Outlet point layer:
Optional:
Flow direction raster:
Move outlets to stream raster:
New outlet layer:

Weighted Flow Accumulation Area

Weighted flow accumulation sums up the number of contributing stream (such as Peuker Douglas) pixels at target pixel. The stream should eventually flow to the outlets.
Flow direction raster:
Modified Peuker Douglas stream raster:
Outlet points:
Weighted contributing area raster:

Stream Network - Drop Analysis

Drop analysis finds the threshold value for stream raster by T test, which evaluates the significant difference between the average drops of the first and higher order streams created based on the threshold assumption. (Note: The input DEM should be in a projected coordinate system.)
Filled DEM raster:
Flow accumulation raster:
Flow direction raster:
Weighted flow accumulation raster:
Outlet points:
Drop table name:
Threshold (m2) Drain Density (1.0E-2, m-1) 1st order stream Higher Order Stream T value
No. Ratio(%) Mean Drop (m) σ of Drop (m) No. Mean Drop (m) σ of Drop (m)

Stream Raster - Threshold

Stream Raster - Threshold tool defines stream raster by choosing pixels from weighted flow accumulation grid with the values larger than the given threshold.
Weighted flow accumulation raster:
Stream Raster Grid:
Threshold (m2):

Extract Streams and Channel Network

This tool outputs stream network and subwatersheds shapefiles. Each stream segment is defined by the links in stream network and subwatersheds are created based on each stream segment.
Filled DEM raster:
Flow direction raster:
Flow accumulation raster:
Stream Raster Grid:
Outlet points:
Stream Network:
Subwatersheds:

Gage Watershed

This tool creates the entire watershed shapefile for a given outlet.
Flow direction raster:
Outlet points:
Watershed:
Store results in folder:
Perform the analysis only for the zone layer specified below:
Boundary Mask:
Option 1: Trace the watershed on the map
Draw Tool:
Option 2: Use predefined NHD Hydrologic unit catalog:
Flow direction:
Pour Point:

I am the SSURGO soil extractor

    toolbar menu
    Zoom to:
    eRAMS
    • Map
    Top:
    Left: Right:
    Bottom:
    Zoom to Address:

    Settings

    font_size_inc font_size_dec
    1:
    Current Scale: ---

    Base Layers


    Google


    Bing

    USGS National Map


    Public Layers

    Geospatial Layers

    Placemarks

    
    • General
    • Symbol
    • Files
    Title:
    Description:
    Location:
    Elev(m):
    Longitude - Latitude:
    AddDelete
    Once you save the placemark, you can add file data.
    Column name:
    Column type:
    Please save changes to edit new column
    Wait
      
      • Select Layer
      • Attribute
      • Spatial Location
      • Run Query
      Load an Existing Query:
      Query Layer:
      • Select Layer
      • Attribute
      • Spatial Location
      • Run Query
      Select an Attribute:
      Operations:
                        
      Attribute Values:
      Value:    
      Query:
      • Select Layer
      • Attribute
      • Spatial Location
      • Run Query
      Select Spatial Location Type:

      By Selection:
      Buffer radius:  m
      By Geographic Location:
      By Relationship:
      Layer:
      Distance:
      m
      
      • Print Info
      • Print Layout

      Title:

      Created By:
      Date:

      Legend - Select Layers to Display
      User Defined Layers Project Layers
      • Print Info
      • Print Layout

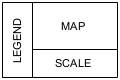
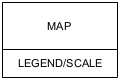
      Choose Template

      
      Edit layer:


      Snapping
      Target:
      Tolerance: m
      Enter WMS URL string:
      Choose Layers:
      Datum:
      Coordinate System:
      Zone: Hemisphere:
      X:
      Y: